
We're all fascinated by enrollment numbers. Each fall, publications across the nation report on local, regional, and national trends. The numbers are usually top-line, with little context or explanation of what they mean. And they usually show a snapshot of one-year's change (enrollment went up by 2.3%, or enrollment fell by 1.7%).
Enrollment analysis, of course, is complex. It includes headcounts and types (graduate, undergraduate, full-time, part-time) and it includes other important variables (like revenue or diversity). And how you measure that success is always changing, and your success is always dependent on the latest definition of that term.
But granular measures are not always available, and if they are, there is no guarantee that people are counting things the same way. So we're left, for now, with numbers. Just raw numbers. Sometimes, of course they're interesting all by themselves.
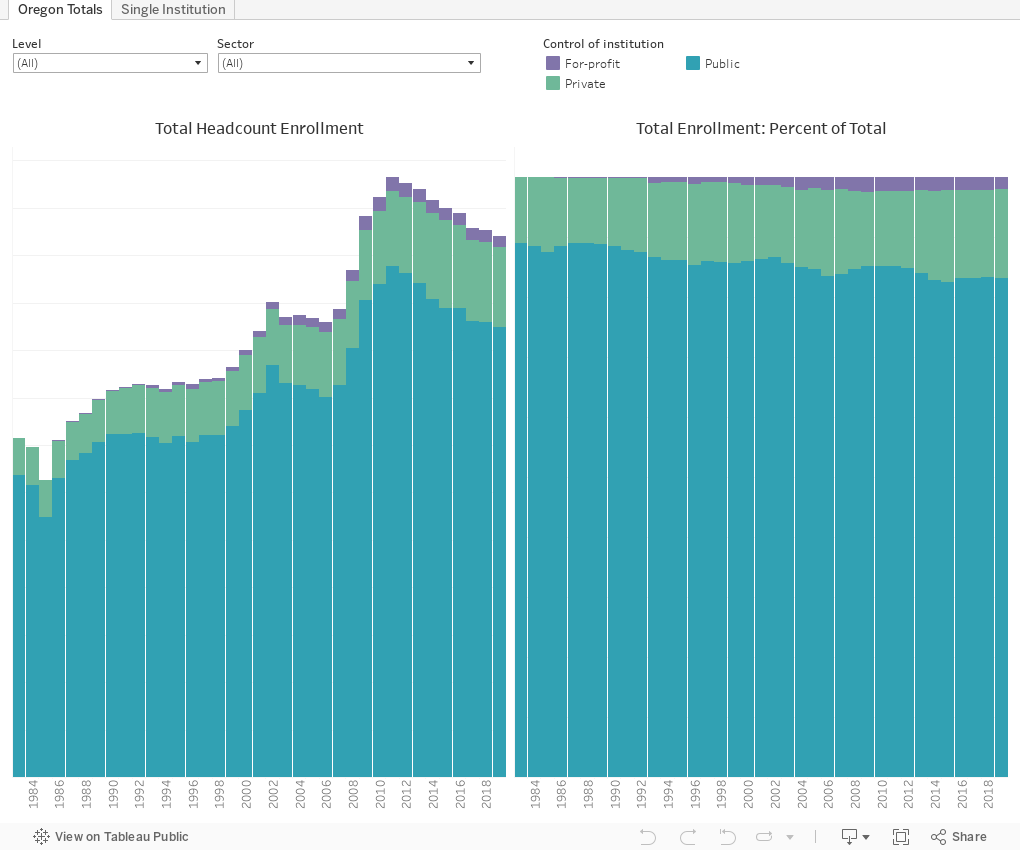
This post deals with enrollment in Oregon, and includes all institutions (public, private, for-profit) and all levels (two-year, four-year, and certificate programs). The first view is a roll-up of all post-secondary enrollment over time, but you can limit the view using the Sector filter (type of institution) or the Level filter (graduate or undergraduate, or both).
The second view shows a single institution of your choice, and breaks out graduate and undergraduate enrollments. The bars show the trend, and the line shows the maximum enrollment since 1980 (note that the IPEDS data doesn't include 1981, 1982, or 1983.) Use the filter to change the institution shown.
I hope this is helpful as you look at college enrollments Out Here in Oregon.
Comments