
Just this morning, The Georgetown University Center on Education and the Workforce released the results of a pretty impressive effort: Trying to determine the ROI (return on investment) of post-secondary education at a specific institution.
In a world where we clamor for clarity and certainty, this might sound like good news: Finally, parents and students can tell whether one college is worth more than another. Right?
Well, not really. But sort of.
In general, the overall trends are not surprising: Four-year degrees are worth more than two-year degrees, at least among the Oregon institutions I've displayed below. And, as many people have been saying for a long time, liberal arts degrees are worth a lot in the long-run, but less valuable in the short-run. But of course beyond general trends, precision in a project this complicated becomes, well, complicated.
So even though my institution, Oregon State, looks pretty good here, there are many reasons why you might not want to take this data to heart, and why you really might not want to make a decision about where to attend based solely on this.
The authors of the study admit this, of course, if you read the whole report.
First, there is no control for location, and most people realize that money in San Francisco is different than money in San Antonio. It does not appear to control for degree mix: For instance, it would surprise no one to discover that engineers do well financially. A school where the main focus is engineering is clearly going to do well overall based on this fact alone. Critically, I can't see that they were able to control for pre-college characteristics, like parental attainment, income, or occupation. We know a lot of advantage can be passed down to students that pays off in the end. And finally, 40-year NPVs (or Net Present Values) are based on people who entered college 40 years prior. A lot has changed since then.
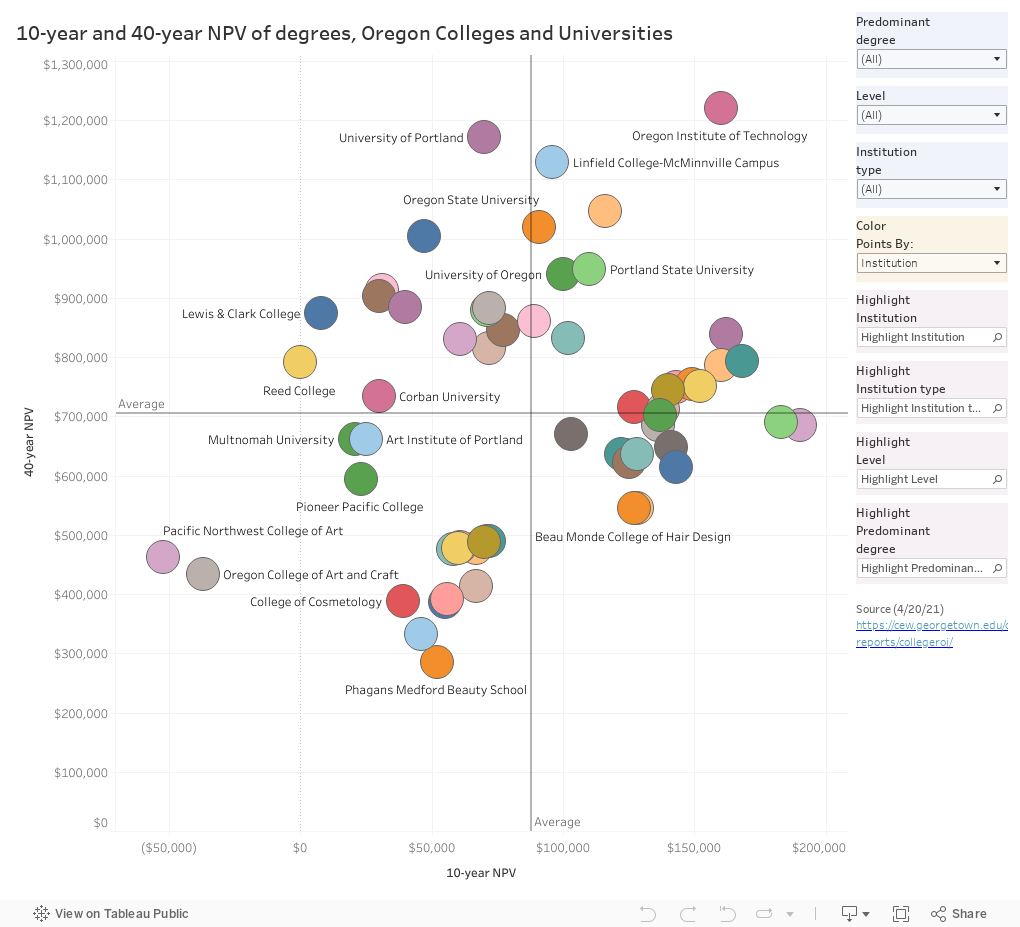
But here is the presentation of the data for Oregon institutions. It arrays each institution by 10-year NPV and 40-year NPV.
It's pretty easy to get the view you want:
Filters (blue controls) allow you to select the college's predominant degree; institutional level; or institutional type. The highlight boxes (pink controls) allow you to identify those same institutions against the backdrop of a larger set. And the Color Points By (orange) control allows you to change the color scheme. Go ahead and play; you can't break it, and you can always use the reset function to take you back to the start.
As always. let me know what you see. We're always eager to hear your feedback Out Here in Oregon.
Comments